New charts from Bank of America-Merrill Lynch’s Stephen Suttmeier suggest two things must happen before the stock market bottoms: The S&P 500 needs to fall another 5% and panic needs to get more extreme.
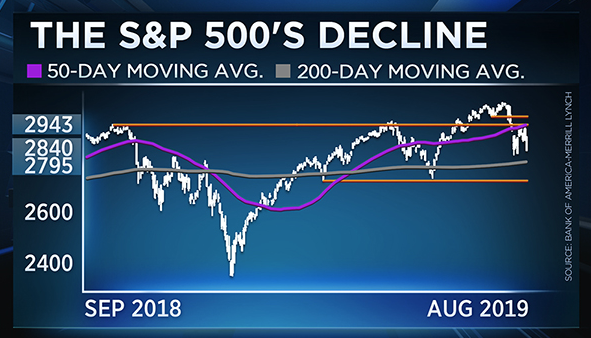
His first chart shows the S&P 500‘s decline, and the key levels to watch.

“The correction is going to continue,” the firm’s chief equity technical strategist told CNBC’s “Futures Now ” on Thursday. “You take a measured move of this trading pattern — one leg down, one leg up. It’s gets you right down into that 2,750-2,740 range.”
Suttmeier estimates it’ll take weeks for stocks to find a floor, especially since the volatility is coming during the worst seasonal period of the year: August through October.
“We have plenty of resistance,” he said. “We continue to stall right around this 2,940 level on the S&P.”
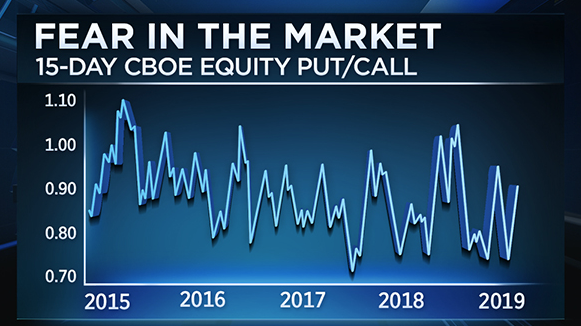
Suttemeier’s second chart reflects fear in the market through the 25-day put/call ratio, which follows put volume relative to call volume. According to Suttmeier, panic isn’t widespread enough for stocks bottom.

“Once you get above one in the 25-day put/call ratio, you can see this S&P bottom. And, that happens probably sometime in September,” said Suttmeier. “We had fearful readings to start June. June was an up month, and we came into August very complacent.”
On Friday, the S&P 500 rallied 1.4% to close at 2,888.68 and is almost 5% away from its all-time high.
