
Traders and financial professionals work at the opening bell on the floor of the New York Stock Exchange (NYSE), May 6, 2019 in New York City.
Drew Angerer | Getty Images News | Getty Images
Evaluating the price-earnings ratio is a deeply ingrained practice for investors. But it isn’t a metric that delivers positive results, Bank of America Merrill Lynch said in a quant study last month.
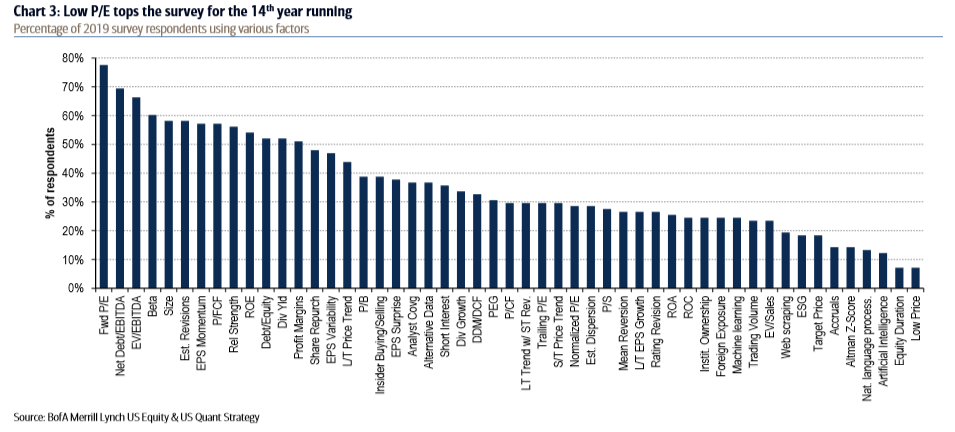
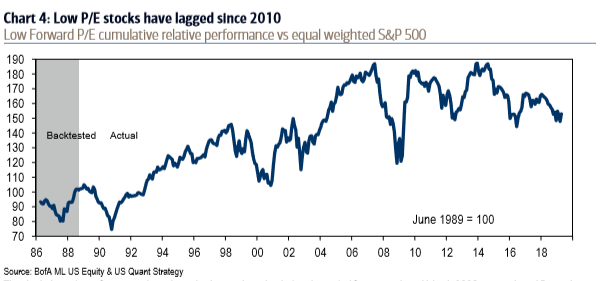
Nearly 80% of investors surveyed by the bank use forward price-to-earnings ratio as a factor when investing, making it the No. 1 factor annually, according to the study. Paradoxically, low P/E stocks have underperformed the market since 2010, the study shows.
“Low P/E remains the most popular factor for the 14th year running despite its weak performance for most of this bull market (the factor lagged by 46ppt since 2010),” Bank of America Merrill Lynch’s equity and quant strategist Savita Subramanian said in a note to clients.
A P-E ratio is simply the current share price of a stock divided by its earnings per share. Forward P/E incorporates a company’s forward looking, estimated earnings per share from Wall Street analysts.
So why is this conditioned practice underperforming the market for investors? Largely because when everyone is investing on a P-E basis, its edge is lost and is already priced into the market. Its “returns may be more likely to be arbitraged away in the subsequent year,” Subramanian said.
The rise of growth investing has also contributed to low P/E stocks underperformance. Instead of value investing, where investors try to buy companies at a cheap valuation and bet on a turnaround in earnings, growth investors buy stocks that are already expensive with expectations earnings will keep growing at a pace that justifies the same or even higher valuations.
The so-called FANG stocks, who generally have higher P/E ratios and are the quintessential growth stocks, have contributed to much of the markets gains in recent years.
Leverage was the second most popular factor, or net debt/EBITDA, according to the study. Beta, size, and estimate revisions were among the other popular metrics.
— with reporting from CNBC’s Michael Bloom.